What is the Water Cycle?
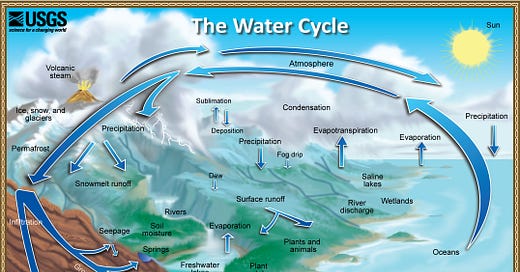
For decades, scientists and engineers have drawn diagrams to depict the water cycle (sometimes referred to as the hydrologic cycle), which shows how water moves from clouds to land to sea and back again. I’m making the assumption here that the reader has a basic understanding of what the water cycle is, so I won’t be describing it in in detail here (if this isn’t the case, you can refer to the first three figures below).
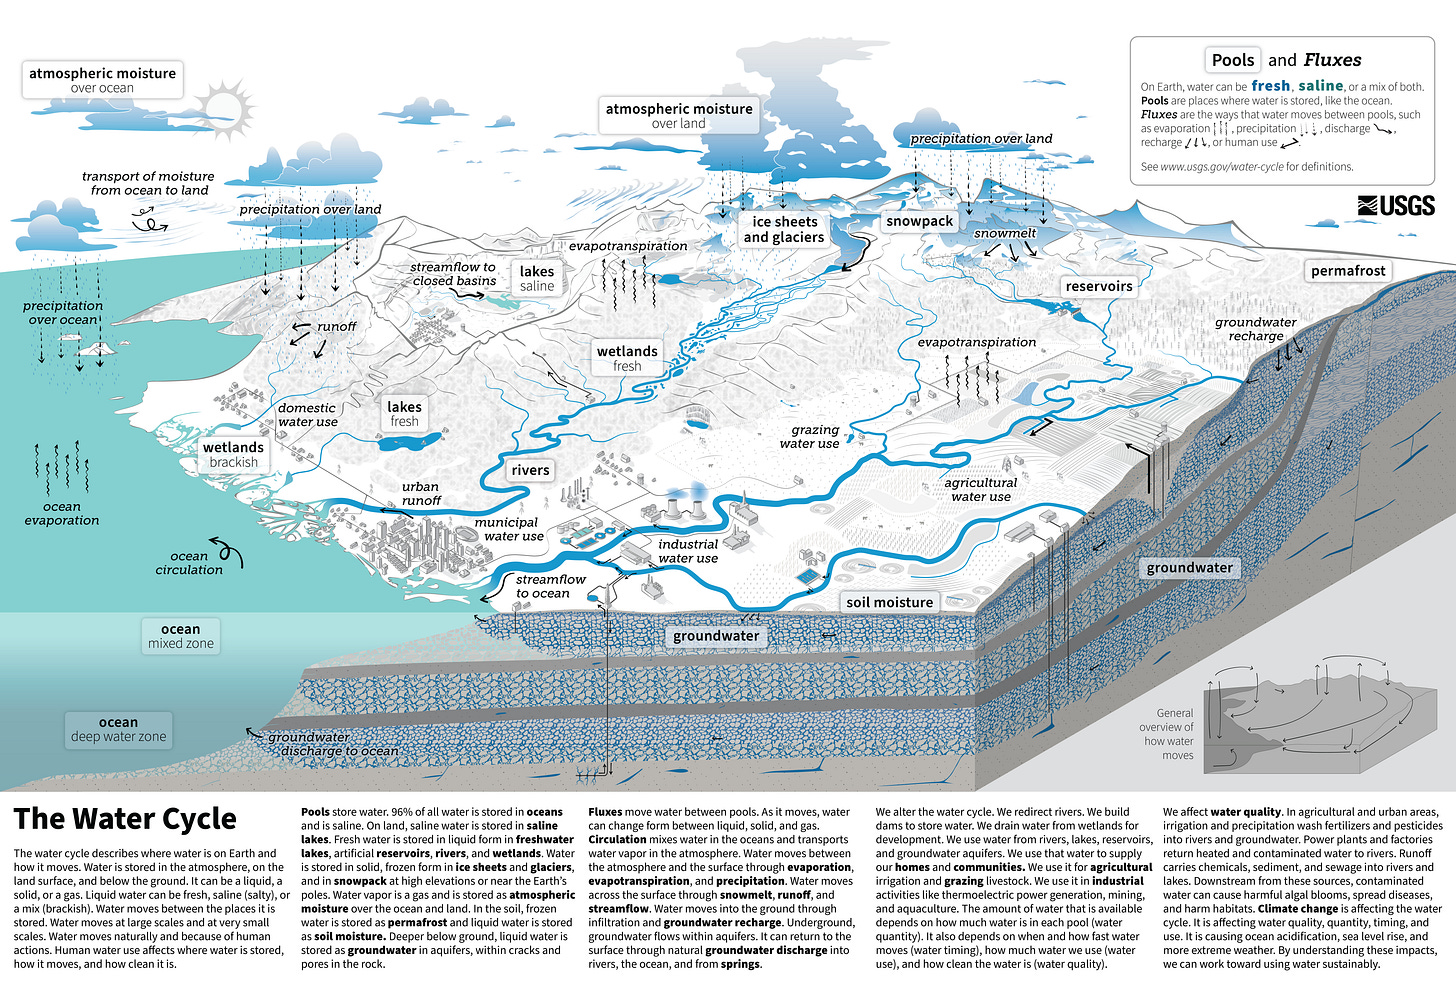
The United States Geological Survey (USGS) published an updated diagram of the water cycle in 2022 that includes the major processes that are part of the water cycle (see below; for this and other diagrams in this article, click on the diagram to get to the website source). This diagram is very detailed and it includes even more detailed text below the diagram itself.
The USGS also published a less-technical, more colourful version of the water cycle. This one shows the many processes without detailed explanations:
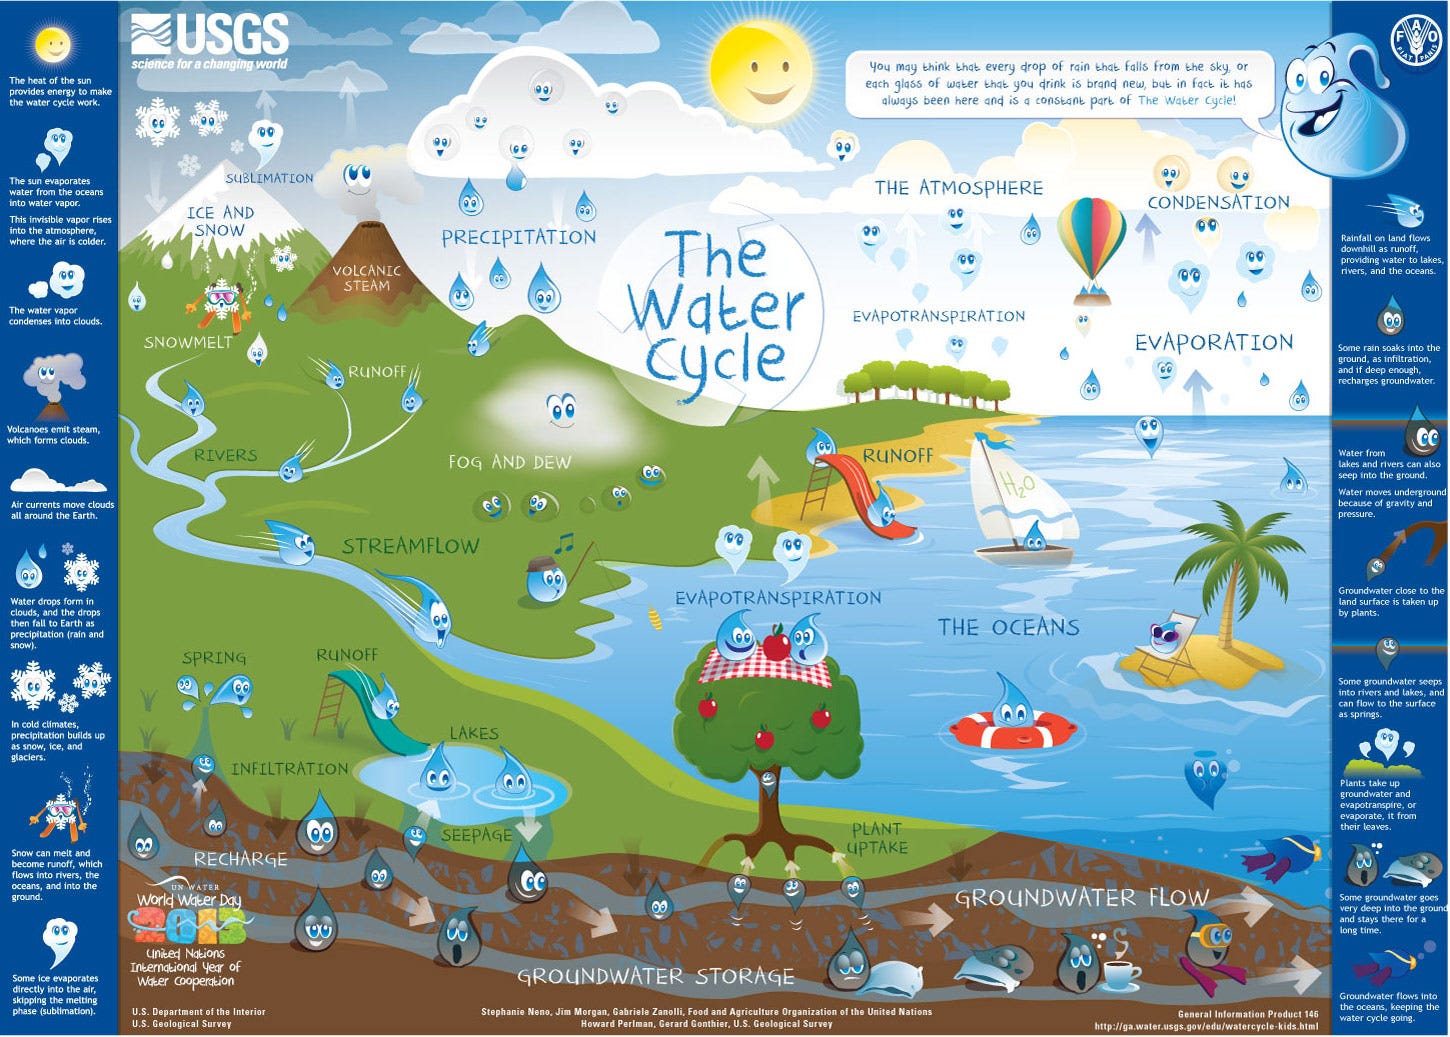
And there’s even a version for school kids. Water droplets are happy-faced and blue as they flow through the water cycle, and there’s more details in the left and right margins:
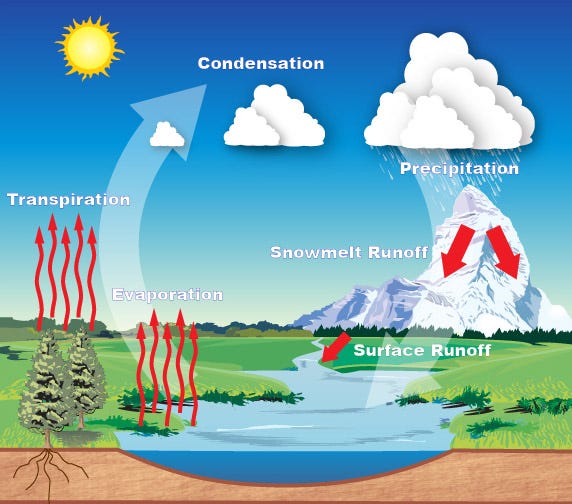
There are hundreds of diagrams of the water cycle (just type “water cycle” into Google and you’ll see what I mean). Each diagram is slightly different but they all show the main processes:
Rain (and other forms of precipitation: snow, sleet, hail) from the clouds down to the earth (landing either on ground or on water)
Water flow along the ground surface (rivers, streams plus water flow along slopes after rainfall events or snow melt) to a body of water (lake, ocean, wetland)
Seepage of water into the ground
Groundwater flow (to a body of water on the ground surface… more on groundwater in future posts!)
And evaporation from surface water bodies to the atmosphere
There are other processes, like transpiration (uptake of water by plants), human activities (water use - from groundwater or surface water), but the five main processes are common to most water cycle diagrams.
There are a couple of items I want to discuss about the water cycle diagrams:
When I see these diagrams, I think about is how they don’t inform people about their role as individuals in the water cycle. In other words, it seems like the water cycle is “out there’; it’s in the rain clouds over our heads, or in the creeks we splash through on our weekend walks, or in the lakes we visit on summer vacations. But where does the water come from when we turn on the taps in our homes? And where does the water go when it goes down the sink or flush the toilet? How much water is needed to provide me with (1) a half-litre of bottled water, or (2) fresh tropical fruit in the middle of winter?
The importance of groundwater is always understated in water cycle diagrams (or even ignored completely… here’s a link to a water cycle diagram from NASA where groundwater is just a word on the ground…).
To address these issues, I will be conceptualizing new diagrams for the water cycle, and the focus of some future articles will be on the importance of groundwater.
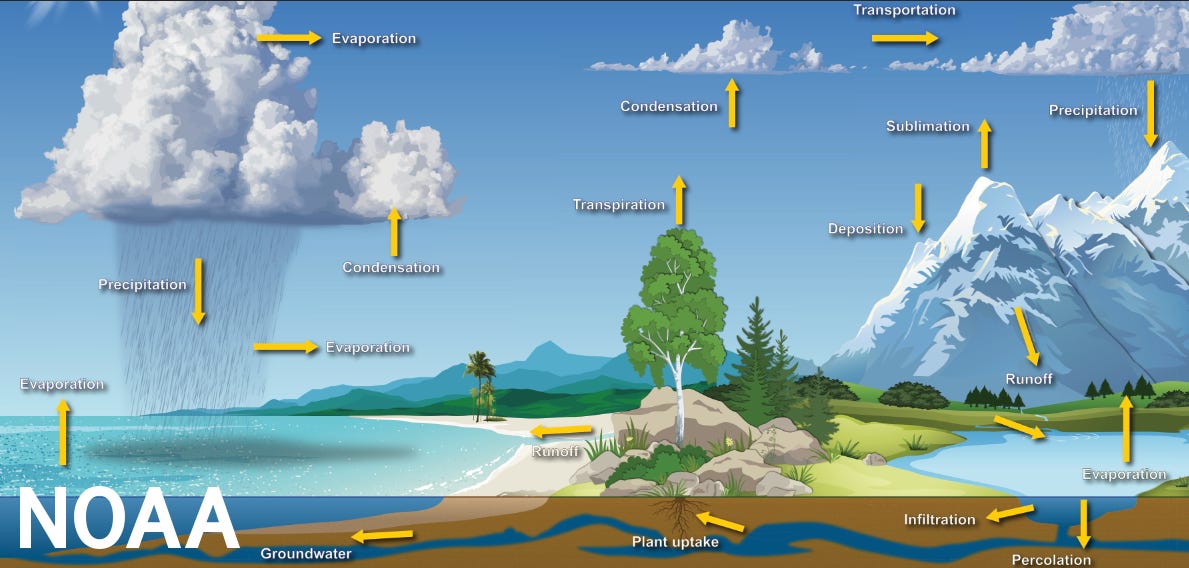
I’ll leave you with two water cycle diagrams: (1) from the National Oceanic and Atmospheric Administration (NOAA). In this one, groundwater resembles underground rivers (which is misleading), and (2) from the National Weather Service (NWS) that doesn’t include any mention of groundwater at all.

