


Flooding in Toronto - 2024
And a comparison with the 2013 flood

In July 2024, southern Ontario was hit by a couple of significant rainfall events. First, on July 11, remnants of Hurrican Beryl dropped over 40 millimetres (mm) of rain, and a week later, on July 17, over 80 mm (about 3 inches) of rainfall hit Toronto1.
The first graph (from https://www.oakridgeswater.ca/) shows the daily rainfall from a weather station in Toronto for the period June 25 to July 25, 2024. The first peak (July 11) The second peak (July 17) came a day after about 30 mm fell on the city, for a total over 100 mm in less than 24 hours.

On July 17, 2024, Pearson International Airport recorded its fifth highest single-day rainfall amount (nearly 100 mm).
Historically, the highest recorded rainfall for one day at Pearson was on July 8, 2013, when over 120 mm of rain fell in 24 hours (that’s nearly 5 inches!). The graph below shows the recorded daily rainfall from May to July, 2013. Between July 8-9, 2013, over 100 mm fell at this location.

In Toronto, the Don River (conveniently located in the Don Valley, and next to the Don Valley Parkway) has its headwaters on the Oak Ridges Moraine, north of Toronto, and flows south about 38 kilometres south through Toronto and into Lake Ontario. The watershed for the Don River is approximately 36, 0002 hectares and is home to 1.4 million residents.
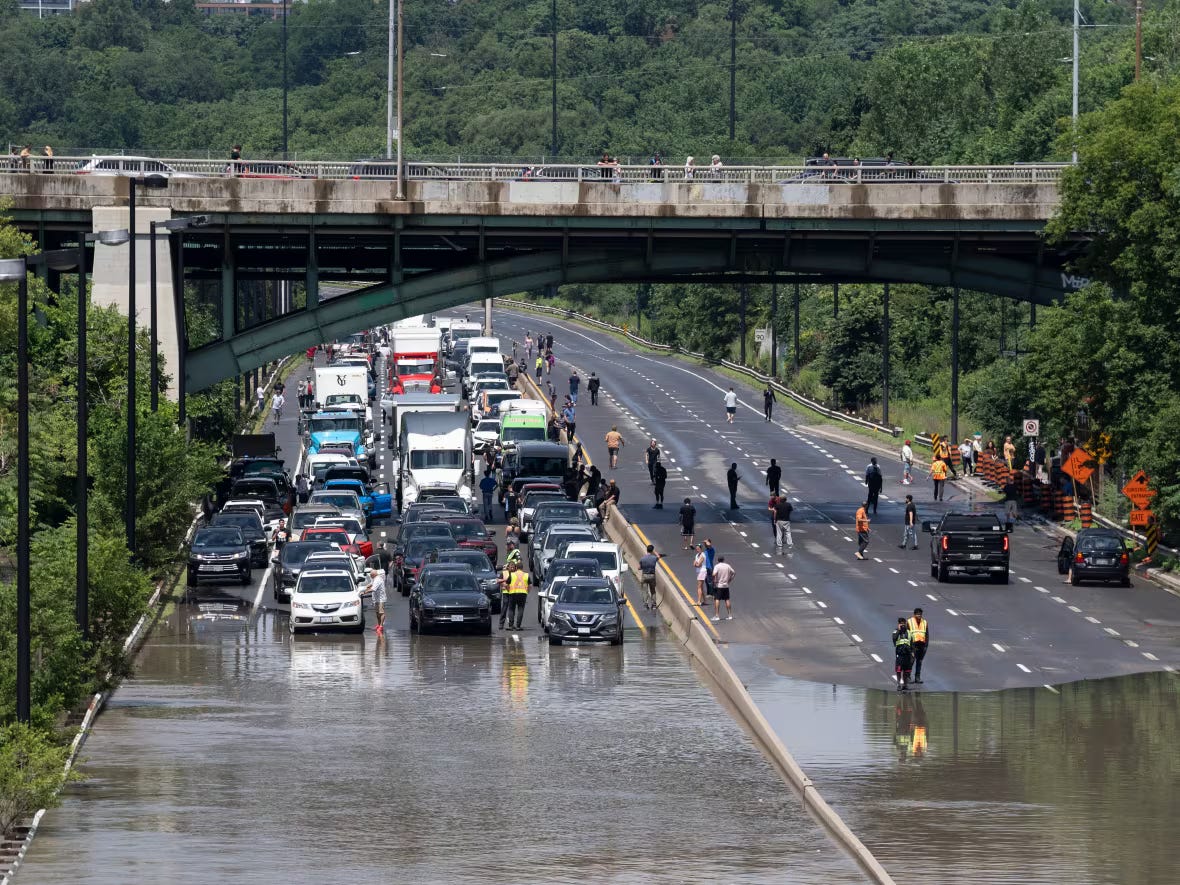
Both high-rainfall events (July 2013 and July 2024) resulted in significant flooding in Toronto. Both floods resulted in closures of subways, trains, and roads. The Don Valley Parkway was closed as it was flooded (see photo below, from July 2024, CBC News).
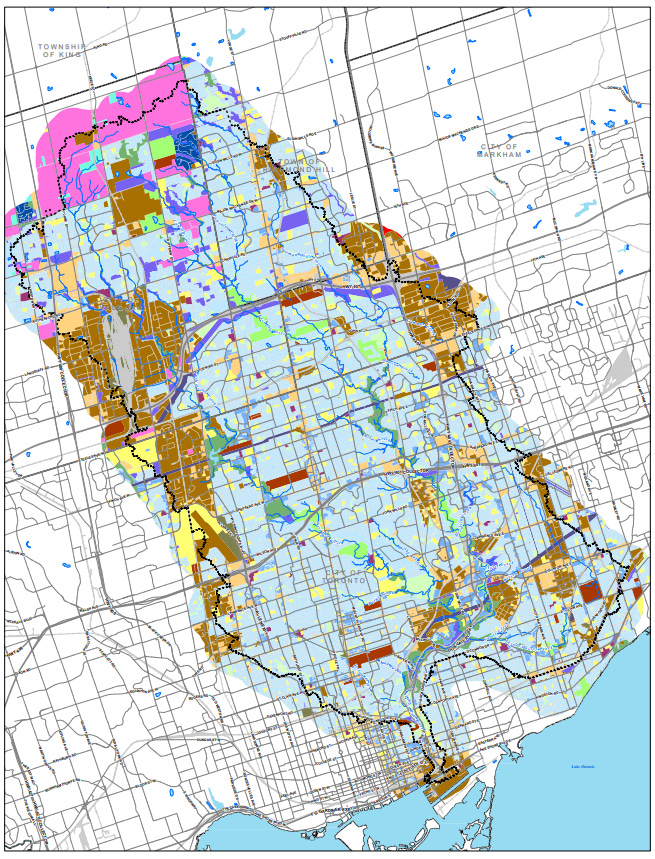
When we get these short-term, intense rainfall events, rain water is diverted directly to sewers, which flow directly to the river system, resulting in very high flow rates in the rivers. And this can happen very quickly in places like Toronto, where so much of the city is paved. The map below (reference here) shows land use for the Don River watershed. The light blue zones are residential and the brown zones are industrial. In essence, most of the watershed is impermeable and rainwater is diverted straight to sewers, creeks and the Don River, resulting in higher volumes of water that exceed the banks of the Don River.
(Note: The pink area in the north is farm land, which will allow water to get into the ground. This allows the water to ‘slow down’, thereby reducing the peak of the flow in the Don River in response to high rainfall events.)
The graph below shows the flow rate in the Don River (orange line) and the height of the water level in the Don for June-July 2024. The first spike is the result of the first rainfall event on July 10, 2024 (Hurricane Beryl). The BIG spike is from the rainfall event on July 17, 2024shows a flow rate of nearly 250 cubic metres per second! Normal summertime flow rates in the Don River this time of year are about 10 cubic metres per second. Similarly, the water level rose about 3 metres during this flood.

Ideally, cities could be designed to reduce the peaks of these graphs3. Water could be slowed down by allowing more of it to infiltrate into the ground or be held in wetlands.
With climate change resulting in more frequent storms and abnormal weather patterns, we can expect more events like these to occur. Cities grow so fast and with growth comes more paved areas. Toronto is no exception. It will cost billions of dollars to ‘fix’ the city such that it can handle these storm events; the fix, however, is not an easy task. Trouble spots will have to be identified, natural areas would have to be re-established and major infrastructure updates will be required. But what’s the alternative? Billions of dollars of damage every time these rainfall events happen.
Thanks for reading the Water Droplet! Stay tuned for more interesting water-related articles. Drop a comment below if you have any questions or comments.
In one year, Toronto gets an average of 800 to 900 millimetres of precipitation. In an average month of July, Toronto gets about 76 mm of rain. So these high rainfall events account for more than the entire monthly average for July.
36,000 hectares equals 360 million square metres. If we assume 100 mm of rainfall across this area, we get 36 million cubic metres of water hitting the watershed in one day. If my math is correct, that equals over 14,000 Olympic-sized swimming pools (assuming 2.5 million litres per pool!)
On this graph, the area under the orange line can be thought of as the volume of water in the river. Ideally, cities could be designed (or re-designed) such that the peak of this orange curve is reduced but the area under the curve remains the same by extending the increase flow at a value less than the peak.