The Grand River, in southern Ontario, flows from around Dundalk, Ontario, south through Fergus and Elora, Kitchener-Waterloo, Cambridge, Paris, Brantford and into Lake Erie - a total distance of approximately 300 km. The Grand River watershed covers nearly 7000 square kilometres and approximately one million people live within this watershed; water management and flood control is a continuing challenge!
On June 23, 2017, the headwaters of the Grand River received about 120 mm (about 5 inches) of rain fall in about 4 hours. The map below is from https://cocorahs.org/Maps/1. Each dot on the map shows the location of a rainfall measurement, with the amount (in millimetres) of rain that fell in the morning of Friday June 23, 2017. The dots are colour-coded based on the amount of rain, so red locations had the most rain during that period.
Recall that the headwaters of the Grand River are around Shelburne, Arthur, Mount Forest.
This second map shows the weather radar from the same day (click here for reference). In this map, the outline of the Grand River watershed is shown. The highest rainfall zone passed right through the headwaters, around Grand Valley and Dundalk.
For reference, this area of Ontario gets about 90 mm (3 to 4 inches) of rain in a typical month of June, on average. So this four-hour rainfall event provided about a month-and-a-half worth of rain!
Over the course of June 23, 2017 and the days that followed, stream flow data shows how the pulse of water from the storm flowed down the Grand River. The graph below shows the flow rate in the Grand River over a five-day period (June 22-26, 2017) at five different locations along the river.
The first (northernmost) location is at Leggatt, which is north of Grand Valley (near Luther Marsh). The peak flow at this location reaches about 200 cubic metres per second (m3/s, normal low-flow in summer at this location is about 0.5 m3/s). An hour or two later, peak flow of nearly 350 m3/s is reached at the Waldemar location (summer low flow is 0.8 m3/s). Nearly a full day later, peak flow of over 900 m3/s occurred at Bridgeport (Kitchener). Summer low flows at this location are about 11 m3/s. A few hours later, the flood pulse reaches Doon in south Kitchener, also at over 900 m3/s (summer low flow is also about 11 m3/s). And over a day after that, peak flow reaches York at about 900 m3/s (summer low flow is about 22 m3/d).

A few points about this graph:
As you travel downstream, flow rates typically increase because more water is added to the stream by tributaries
The peak of the storm pulse appears to take over two days to travel from the north (Leggatt) to the south (York)
The decline in the flow rates (known as the recession) can take several days
There is an important dam along the Grand River. The Shand Dam, at Belwood Lake near Fergus, Ontario, was built in the 1940s for flood control. By storing water during high rainfall events, the rate of downstream flow can be controlled. During this 2017 event, the water storage at the dam rose quickly from about 88% capacity to nearly 100% (see graph below):
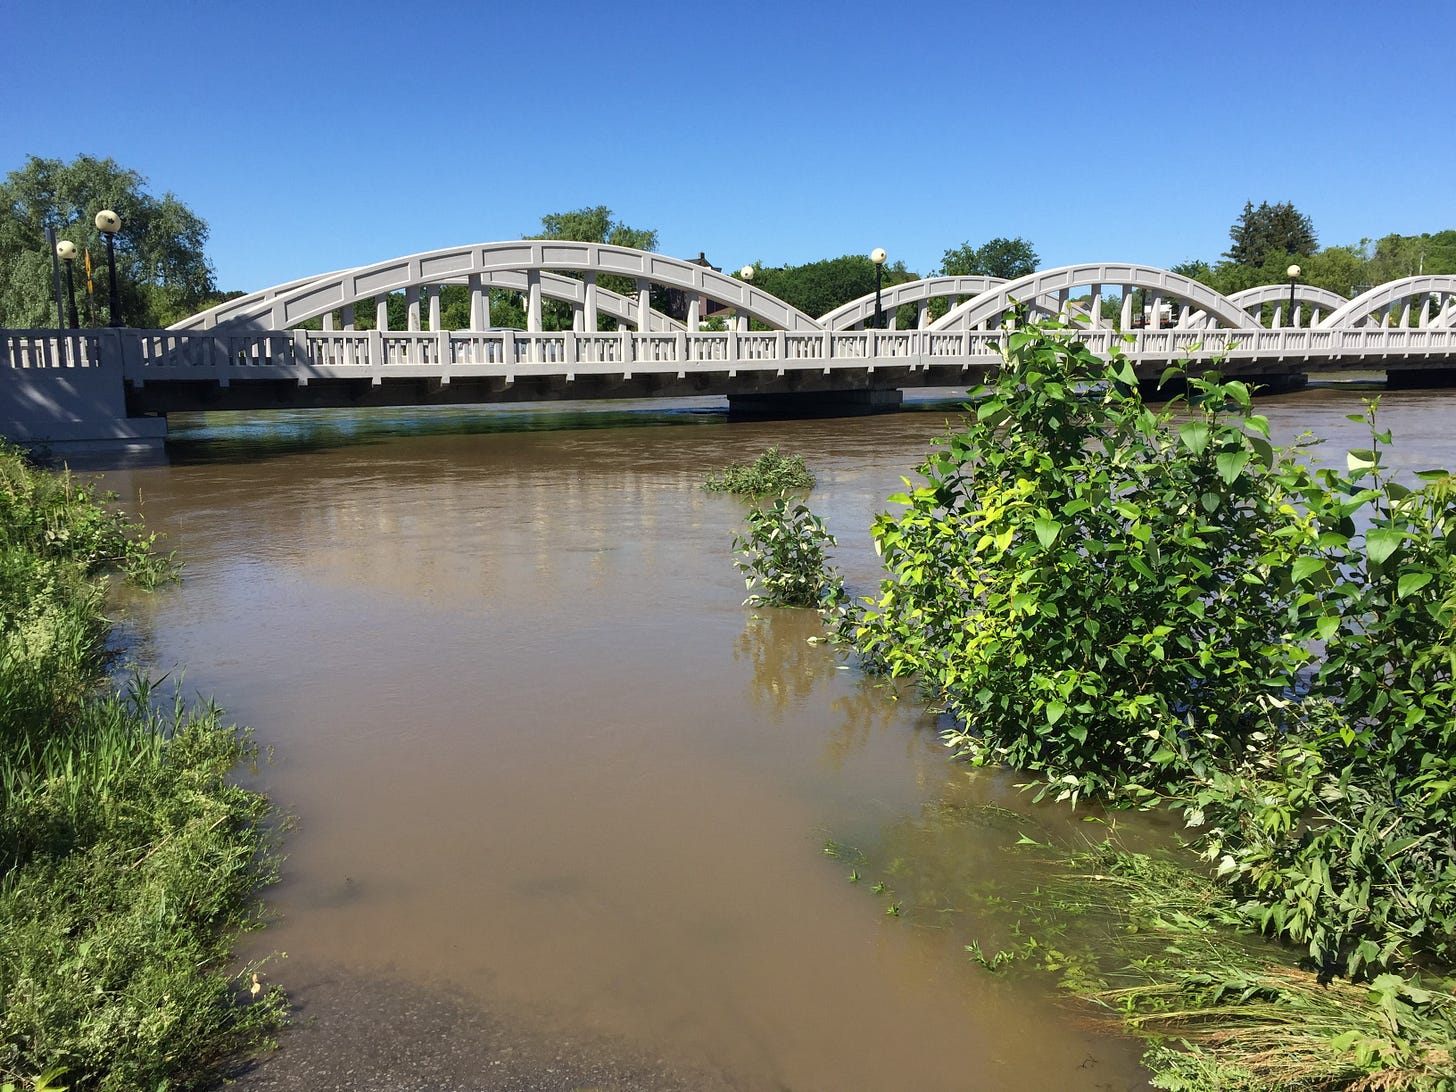
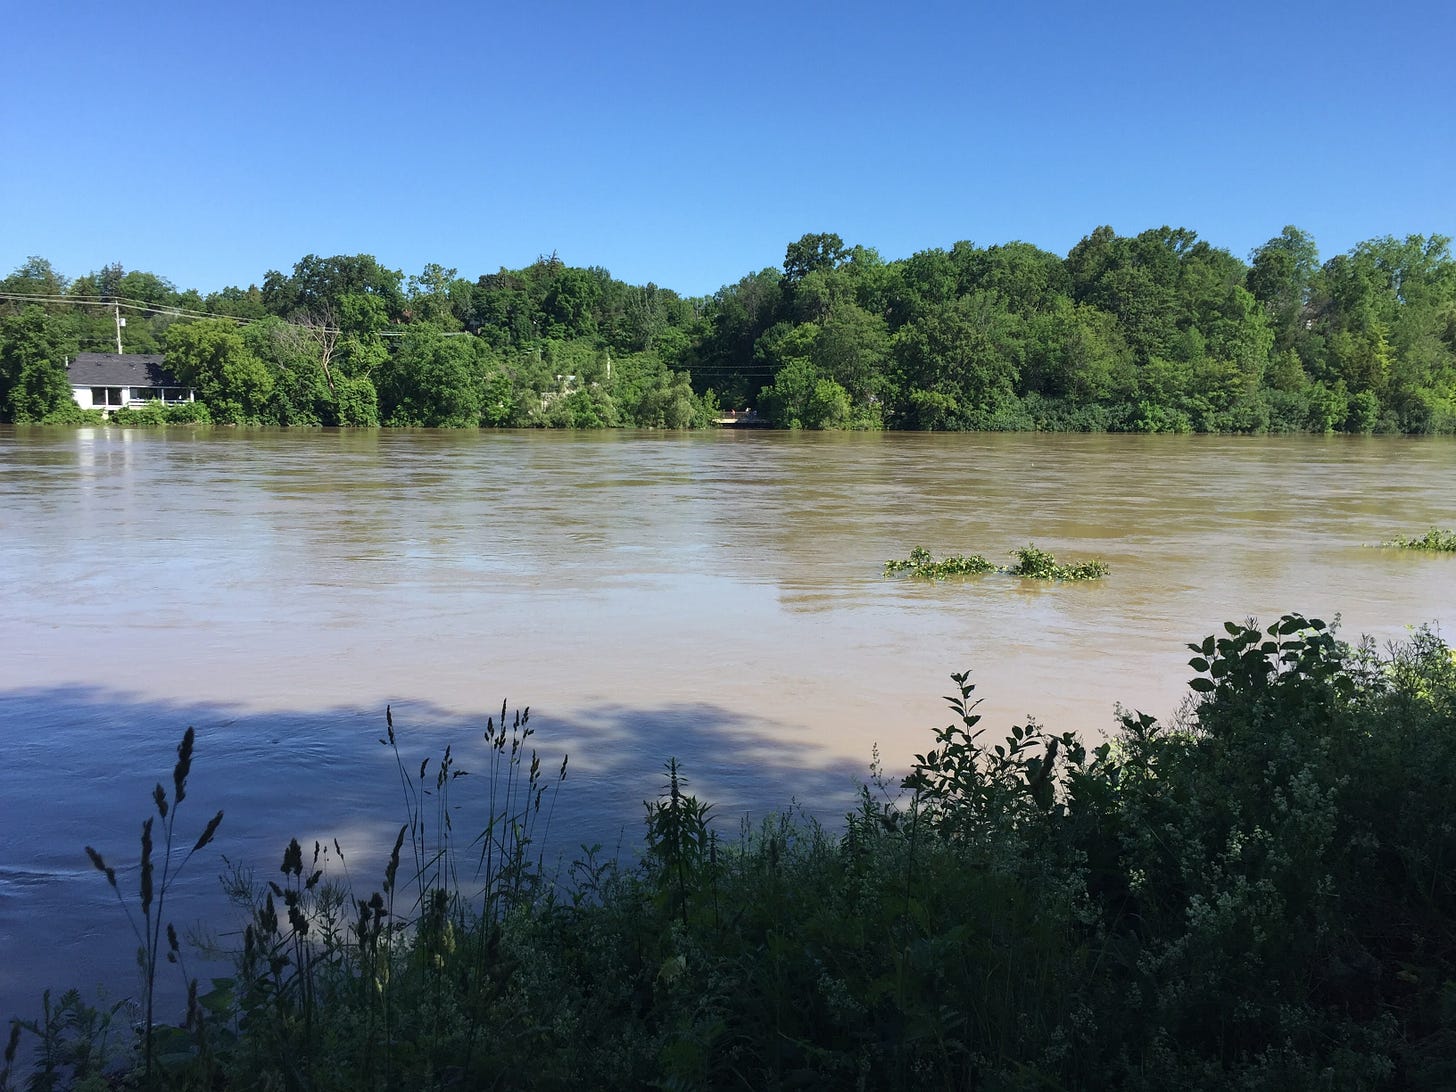
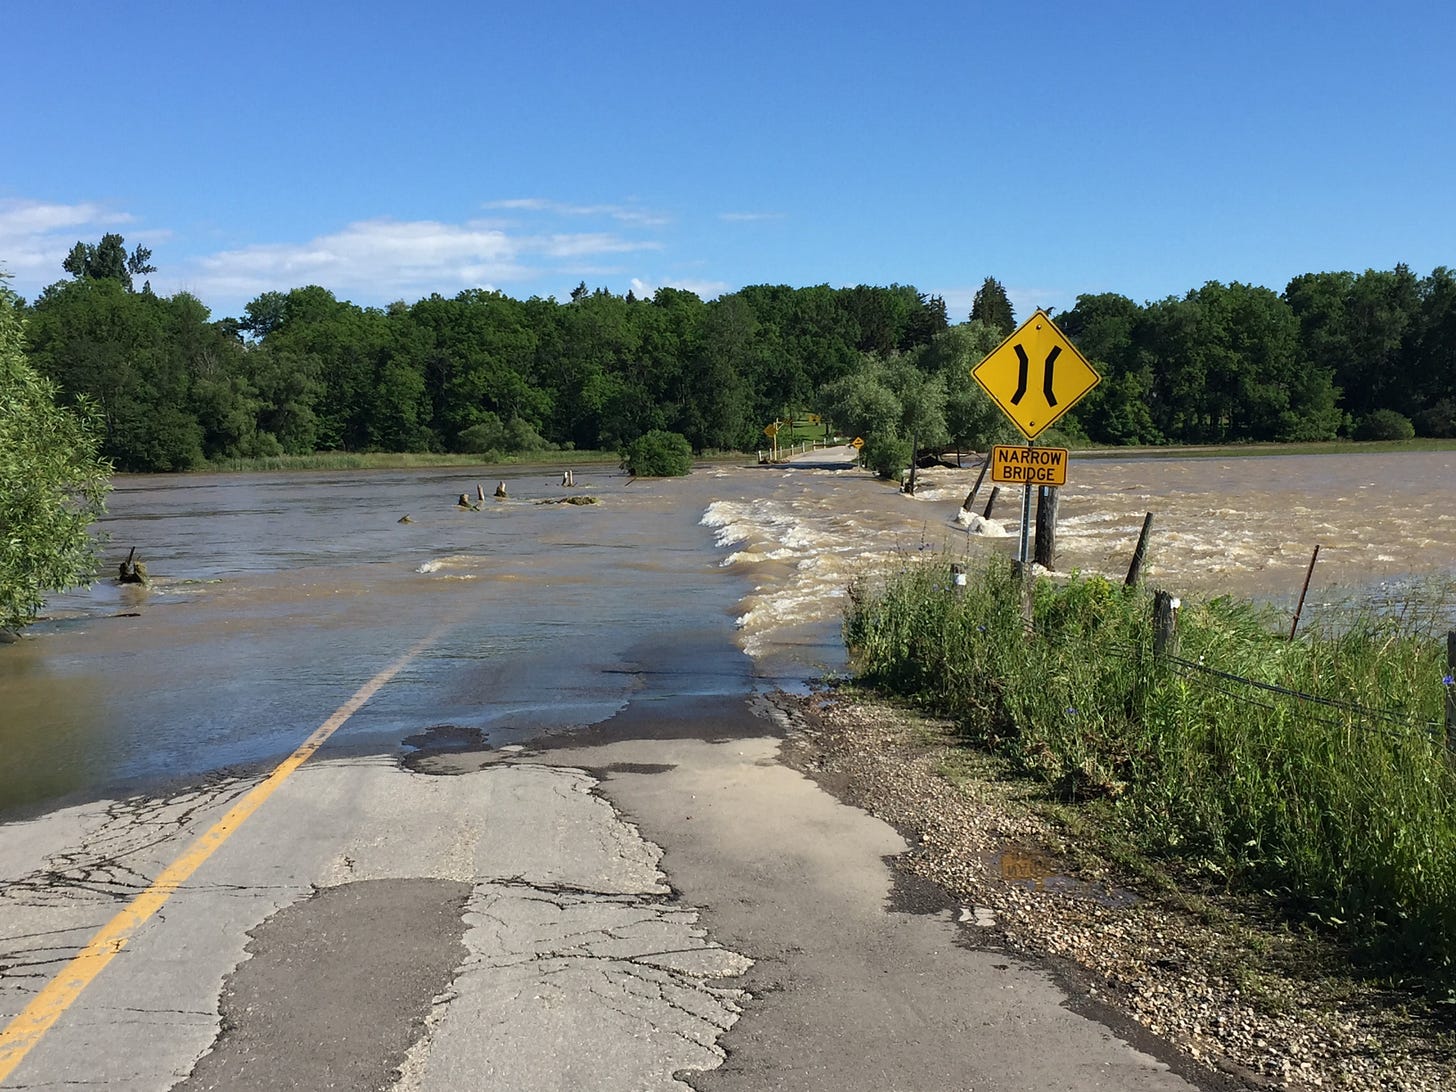
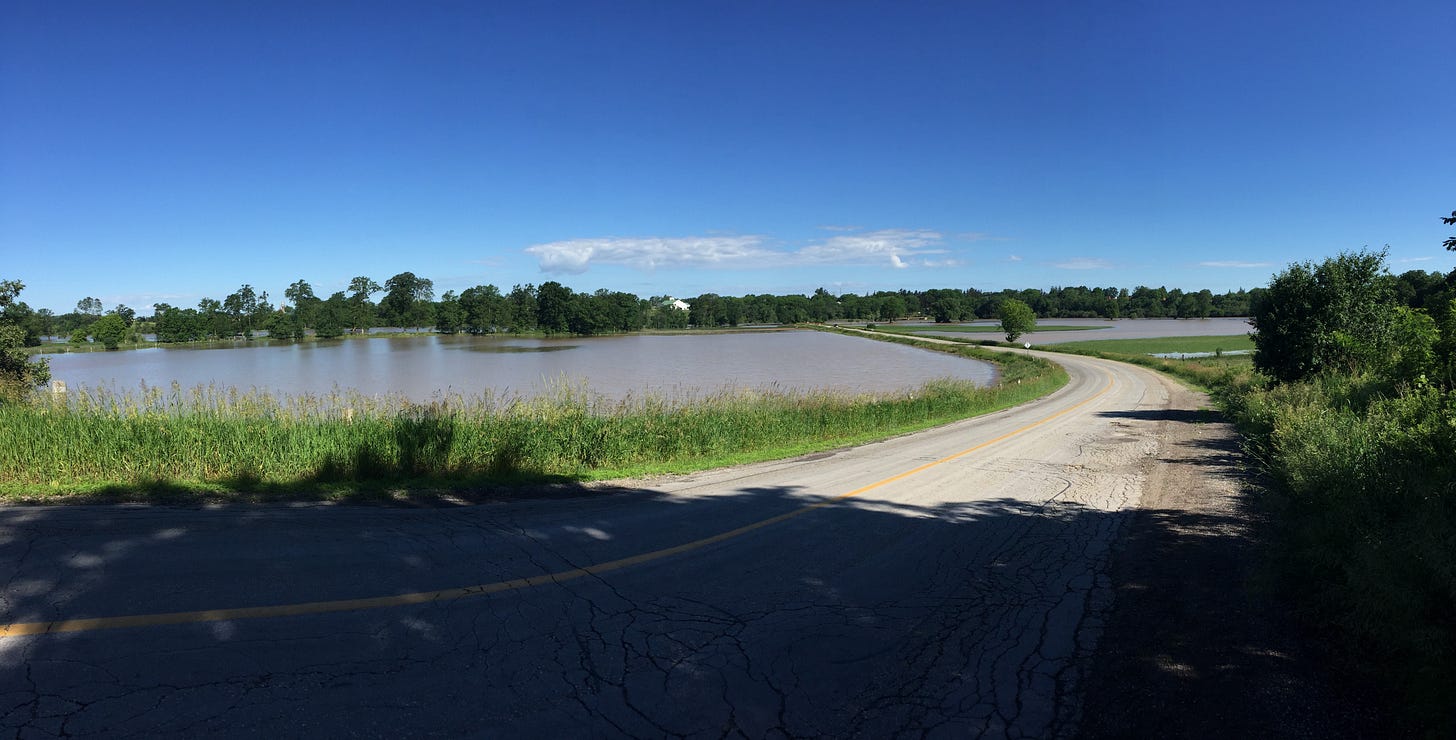
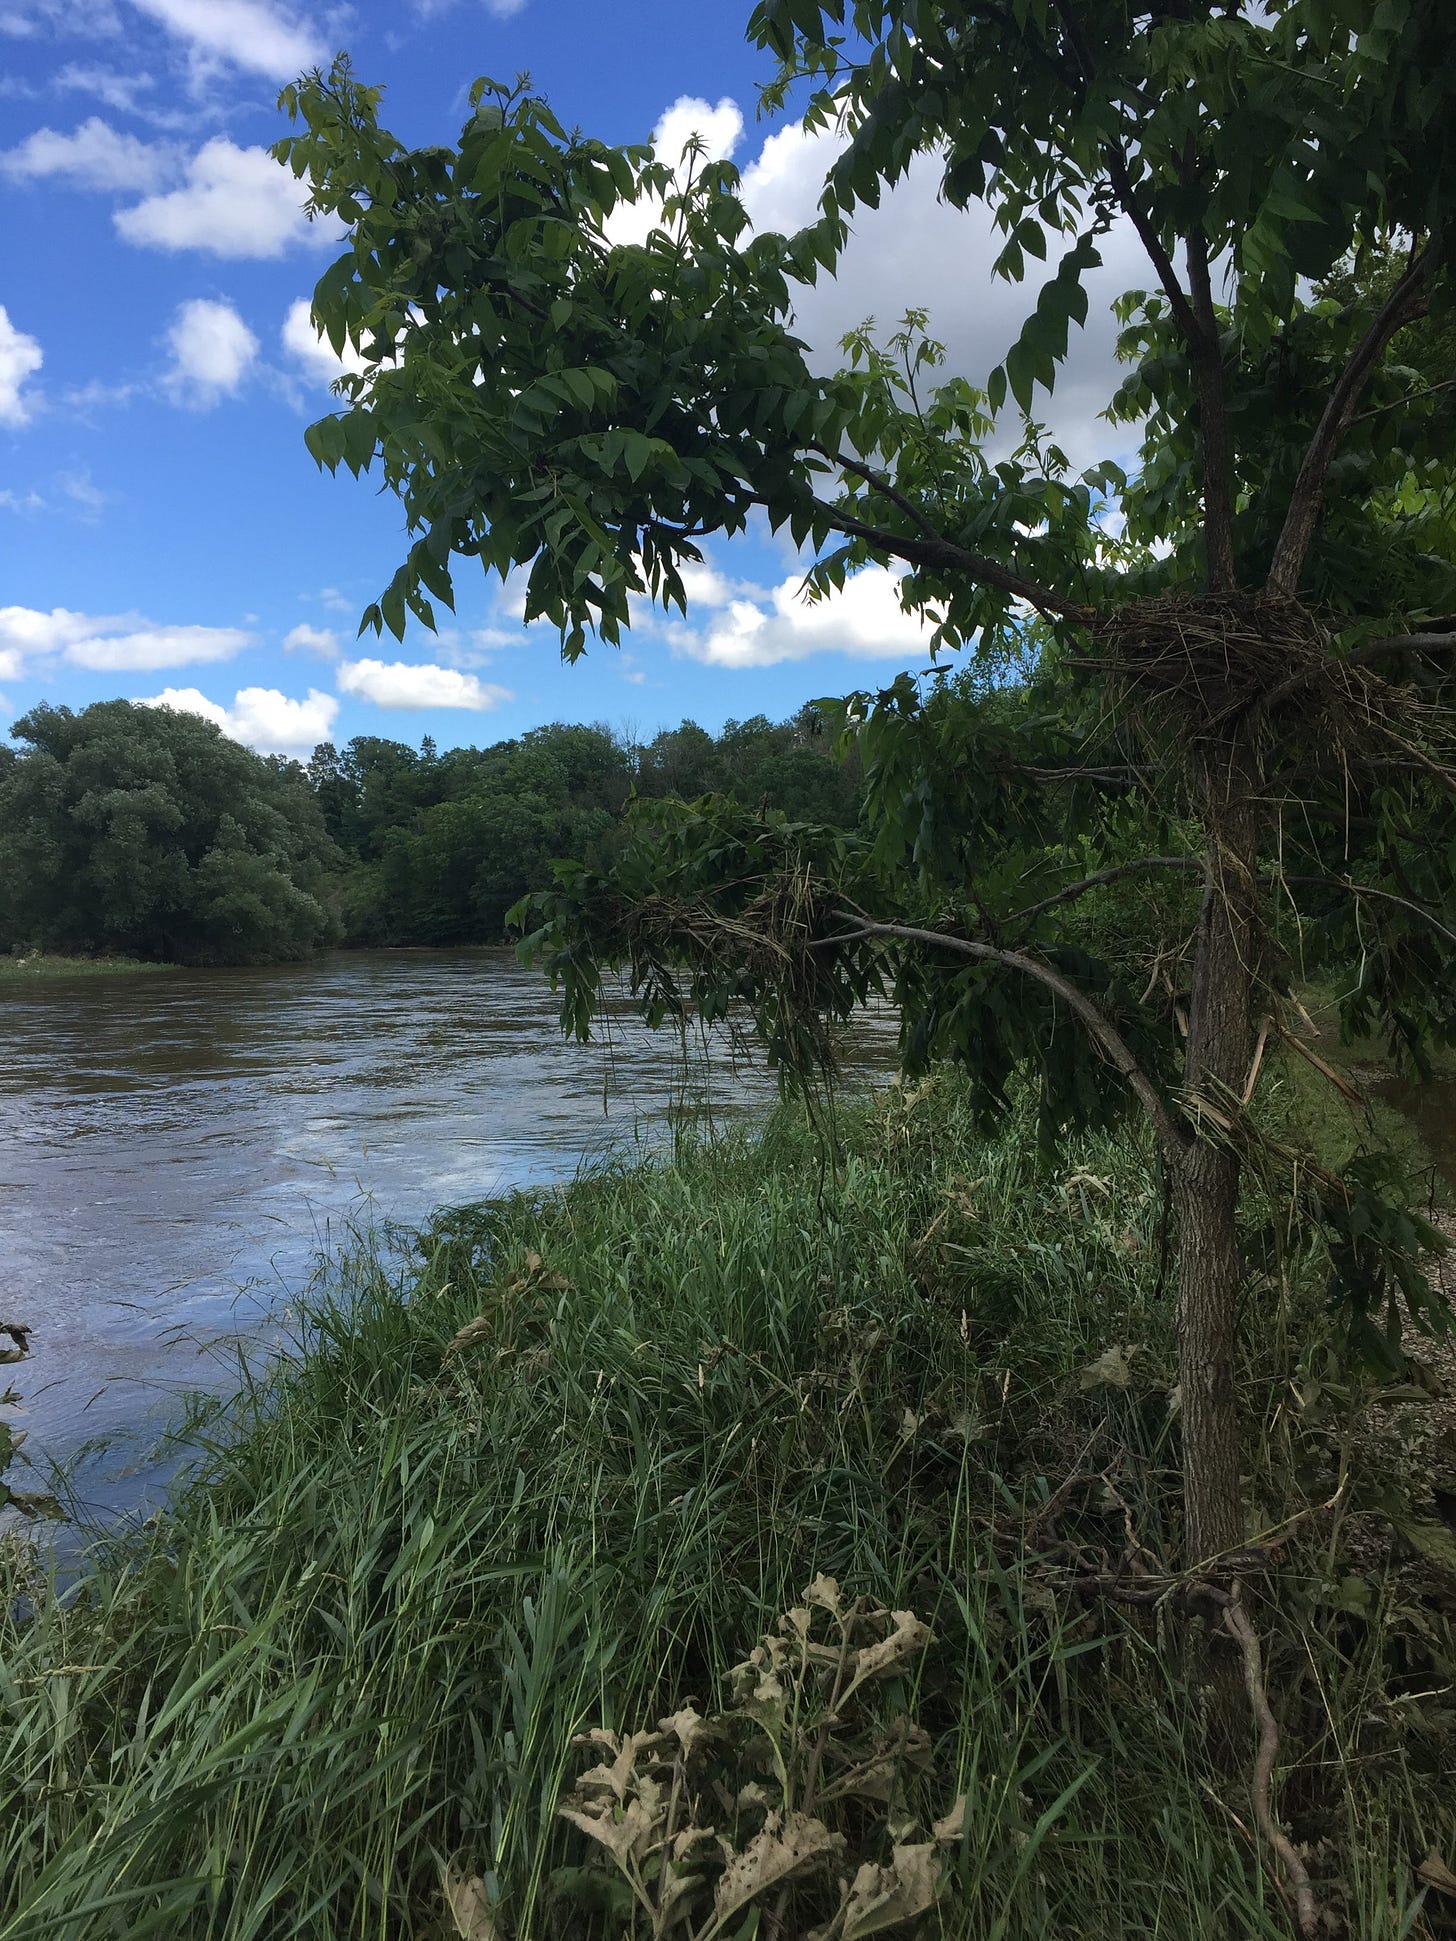
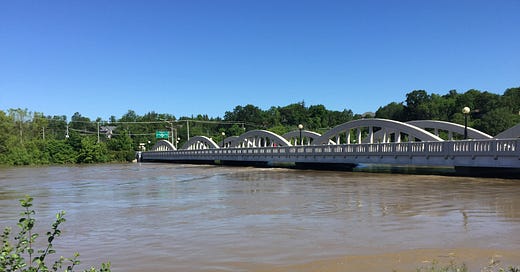
On the morning of June 24, 2017, I rode my bike to a few places along the Grand River to see these high flows. I’d been monitoring the river through the Grand River Conservation Authority’s live-data website and I knew that flow rates close to home would still be extremely high. Here are a few photos from that morning:
A couple days later, the river had receded but was still well above normal. I went out again and saw remnants of what the flood left behind:
A few concluding comments:
Flooding events like this are rare, but are becoming more frequent as our climate is changing. Flooding events are classified by their magnitude and frequency. For example, a 10-year flood is one where stream flows reach a level that is predicted to occur once every 10 years. A 50-year flood, then, might occur once every 50 years. This 2017 flood had flow rates not seen since a big flood in 1974 so it might have been a 50-year flood.
The high rainfall event on June 23, 2017 covered the northern 1/3 of the Grand River watershed. Rainfall totals further south were much lower. Had this rain event covered a larger area, flooding could have been more severe.
This flood event shows how sensitive our watersheds are. All of that rainwater has to go somewhere. It fell so fast, it didn’t have time to sink into the ground (plus the ground at that time was already mostly saturated). So the rain flowed to streams and to the Grand River.
Building homes on floodplains is usually a bad idea. One of the main tributaries of the Grand River, the Nith River, does not have dams or reservoir storage. Flooding can be an issue for residents of New Hamburg, through which the Nith flows.
Dams are built to control water flow during high rainfall (and snowmelt) events. The Shand Dam helped to regulate flow levels downstream (see this link for some details on how the Shand Dam worked during this 2017 event in the West Montrose area, where streamflow reached about 500 m3/s. It was estimated that without the Shand Dam, streamflow could have reached as high as 750 m3/s.
Dams only work upstream! Many tributaries in the watershed are unregulated. In other words, there is no way to control flow during high-flow events. The Shand Dam does a good job of controlling flow along the main channel of the Grand River, but if stream flow in unregulated tributaries is high, flow in the Grand River can still lead to flooding conditions.
CoCoRaHS is a website I recently discovered. The name stands for: Community Collaborative Rain, Hail and Snow Network and it is a non-profit, community-based network of volunteers working together to measure and map precipitation. Their aim is to provide high quality data for natural resource, education and research applications. More info here: https://cocorahs.org



Really interesting.
Thank you